
What is a metrics hierarchy and what is it for?
The metrics hierarchy is a structure that helps you navigate through a large number of different metrics and make informed decisions for further product development. It shows not only the metrics (indicators) themselves, but also how they are related to each other, how they influence each other and, ultimately, the success of the product as a whole.
Using a hierarchy of metrics, you can:
1. Achieve a clearer prioritisation
A hierarchy of metrics can help to prioritise the backlog (list) of tasks for a product more efficiently - you choose which metric you want to grow and define related tasks that will help to improve this metric. This allows more precise selection of tasks in the release[1] and the team understands more clearly why this or that functionality is being done.
2. Provide clear visualisation
It is a good tool to visualise product metrics, it is not always possible to see in a large amount of information the metrics that are important and affect the success of a product
3. Show connectedness and achieve transparency
A hierarchy of metrics helps to establish how they are related to each other. Often in large organisations, each department has its own KPIs, but it is not always clear whose actions influenced the product results.
The bottom line is that the metrics hierarchy is not just a fancy term, but a powerful tool that makes product work more efficient, transparent, and effective.
How do you build a hierarchy of metrics?
Building a hierarchy of metrics is a process that will require a bit of analysis of your product and its goals. Here are some steps to help you do just that:
- Define the primary purpose of your product this will be the top of the hierarchy
- Break down the goal into its components - what factors influence the achievement of the main goal?
- Decompose each factor - keep breaking factors down into smaller components until you get to metrics that can be measured directly.
- Build a hierarchy - organise the metrics into levels, starting with the primary goal at the top. Link the metrics with lines to show how they relate to each other.
- Check the logic - make sure each level of metrics flows logically from the previous one. If a metric is not related to the main objective, it may be worth removing or moving it.
How to properly decompose metrics?
The groups into which metrics can be divided in the hierarchy depend on the product and the target metric that the financial institution is developing. In general, three main groups can be distinguished:
- Business metrics are generalised business goals, they are usually at the top as they are the highest priority for the company. In a bank or financial organisation, such metrics would be profit, size of loan portfolio, size of deposit base, etc.
However, based on these metrics, it is not always possible to assess the real picture of interaction with the product, as many of them are "lagging" - it is possible to track the failure to meet the expected indicators after the fact, when the profit has already decreased, or the loan portfolio has fallen. Therefore, there is a separate category of metrics that allow you to monitor the situation every day and correct actions promptly -- you need to find "leading" metrics for the product and add them to the hierarchy.
- Product metrics are metrics that show how your user interacts with your product.
These include, for example, the following metrics: DAU (daily active users), MAU (monthly active users), NPS (Net promoter score), number of successful loan applications, LTV, CAC, etc.
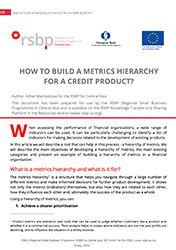
Tracking product metrics helps to monitor business metrics, make changes to the product and continue to develop it. There are a large number of product metrics and they are also categorised into groups. In order to organise all product metrics, many frameworks have been developed to define product metrics and each of them can be used for better visualisation - AARRR, North Star, OMTM, HEART (presented below in Diagram 1).
- Intermediate metrics (also called product quality metrics) - these don't show the final metrics themselves but are very helpful in using product metrics.
For example, calculating the conversion of an application to an approved loan, "Time to Yes" - the time during which the client receives approval for the loan.. Or the speed of completing a loan application. This group also includes technical metrics related to error rates, such as the number of unsuccessful transactions, etc.
Intermediate metrics allow you to look at the details of the user's interaction with the product.
Diagram 1: Existing frameworks for visualising product metrics
Example of building a hierarchy of metrics
Let's take a bank's mobile app and try to build a simple example of a metrics hierarchy.
Level 1
The metric that the financial organisation wants to increase - most often profit - will be included on top.
Level 2
Let's go down a level. To do this, let's answer the question: what affects the profit of a mobile app? Usually, it is the following indicators:
- New app users - The more app users an app has,, the more likely they are to make transactions that will generate revenue
- Returning users are loyal active customers who use the app on a regular basis.
Level 3
Go further and at each level identify metrics that have a direct impact on the level above:
What does the number of new users depend on?
- From the number of downloads of the app: the more downloads, the greater the likelihood of getting new users..
- However, there is an intermediate metric to consider here, such as "conversion to registration". After all, it is important that users not only download the app, but also become a full-fledged user and successfully complete the registration process in the app.
What does the number of returning users depend on?
- From the number of active users. Here it could be useful to evaluate: how many people are using your app regularly? You can add metrics such as DAU (daily active users), MAU (monthly active users) and track unique users who logged in and made targeted actions in your app during a day or month.
- From the number of reactivated users. Ask the question: Did you manage to get back those users who stopped using the application?
Level 4
Transactions. The next group of metrics that affects revenue is how many transactions and how much money our users make.
- Number of clicks on services: are users interested in banking products?
- Conversion to transaction: how many clicks turn into real revenue-generating actions?
- Successful transaction rate vs non-successful transactions?
Further, by defining each next level of the metrics hierarchy, you break down the complex mechanism of a mobile application into understandable components. And you can see which factors influence the success of the product and can work on improving them in a targeted way.
Building a hierarchy of metrics for a credit product
Let's make an example of a hierarchy of metrics for a credit product, following the algorithm described above.
Level 1
The main goal of a loan product is profitability, so this metric will be at the top of the hierarchy.
Level 2
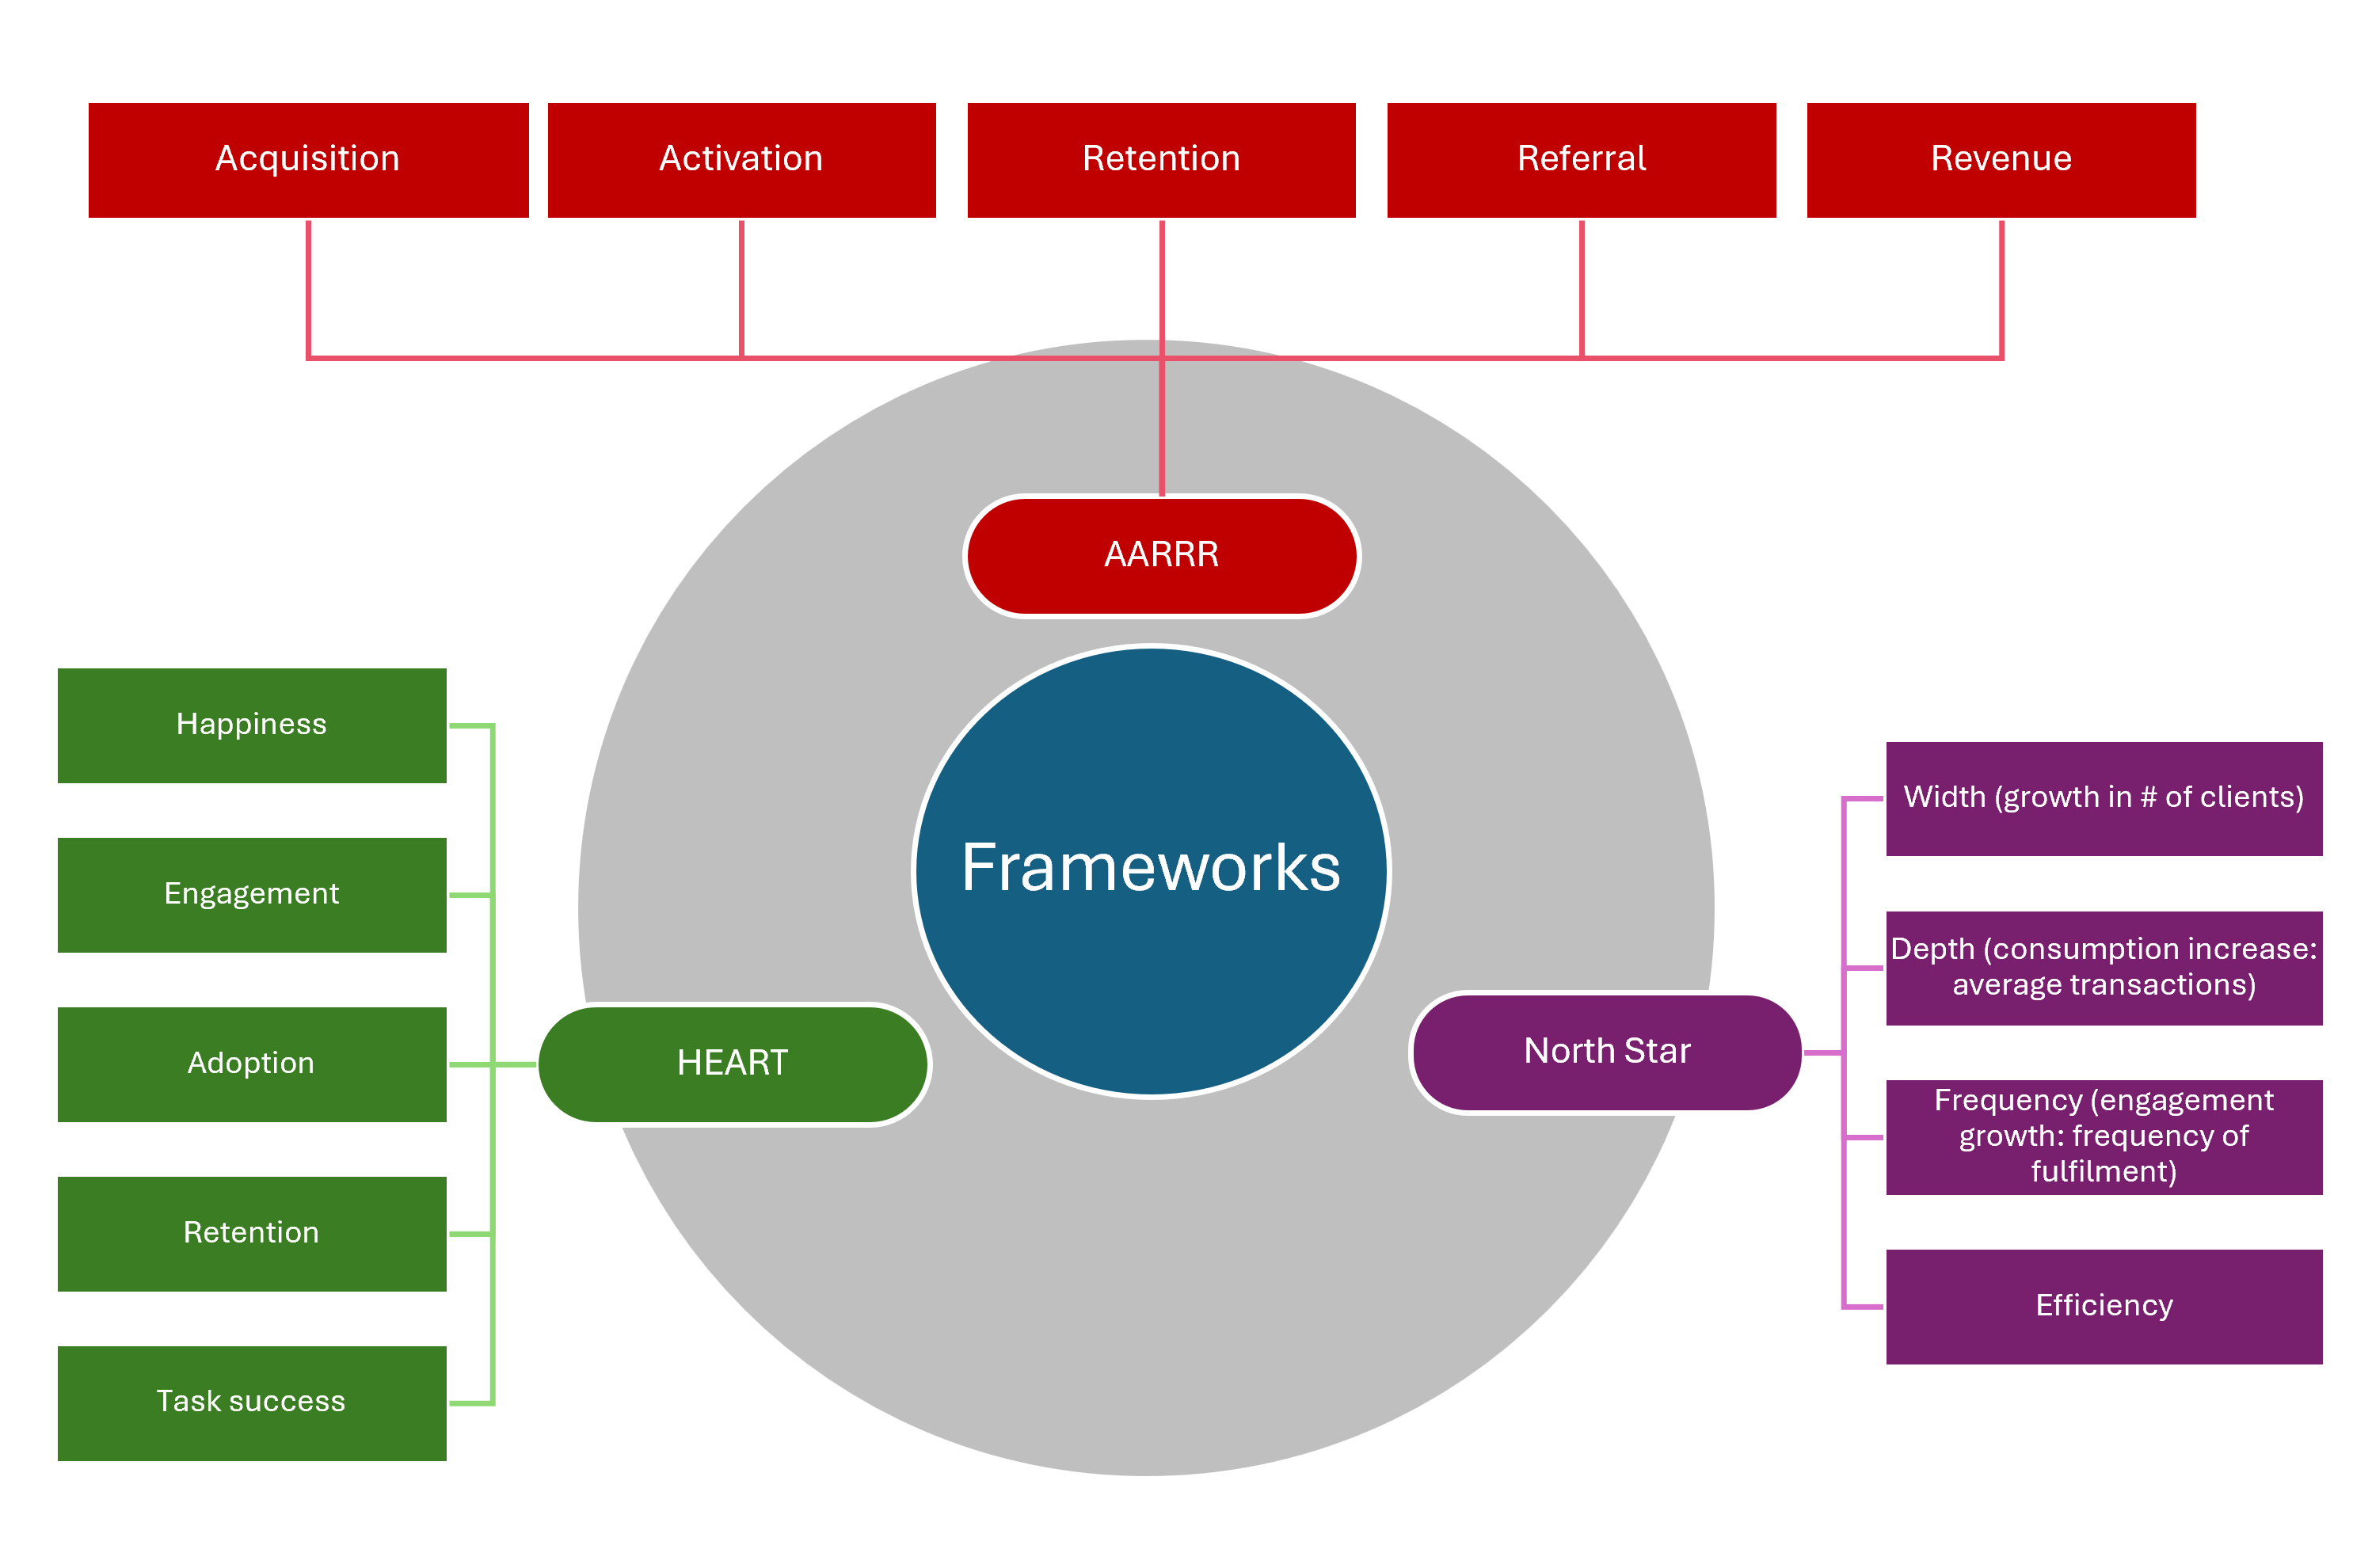
At the next level, we identify important components that affect the profitability of the loan portfolio:
- Number of loan applications - the more applications, the more potential loans the bank can issue
- Lifetime value - profit from one customer for the whole time of working with him/her
Diagram 2: Outcome of the metrics hierarchy (level 2)
Level 3
Let's go down to the next level of the hierarchy.
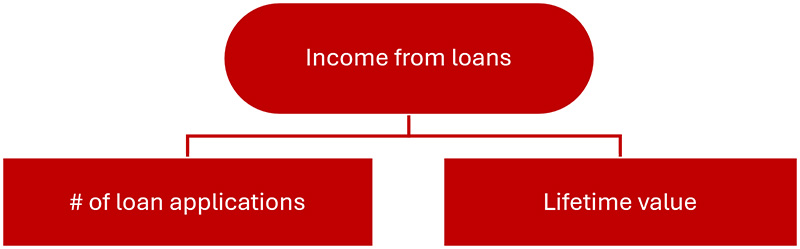
Answering the question: what does the number of loan applications depend on?
- On the number of new customers: the higher number of new customers you have, the more likely they are to submit credit applications.
- On the number of repeat customers: How many repeat customers who had previously obtained a loan from our bank were we able to retain and reissue new loans to them?
What does Lifetime value depend on?
- From the average loan amount - an increase in the average amount of disbursed loans directly increases the portfolio volume, in the case of this metric we also have to take into account the risks and solvency of borrowers.
- From the interest rate on the loan.
- From the term of the loan - how long the customer will pay interest on the loan.
- Default rate - if the number of defaulted loans is very high, this can significantly reduce LTV.
- Customer acquisition cost (CAC) - the cost of customer acquisition.
Diagram 3: Intermediate result of the construction of the metrics hierarchy (level 3).
Level 4
Next is level 4:
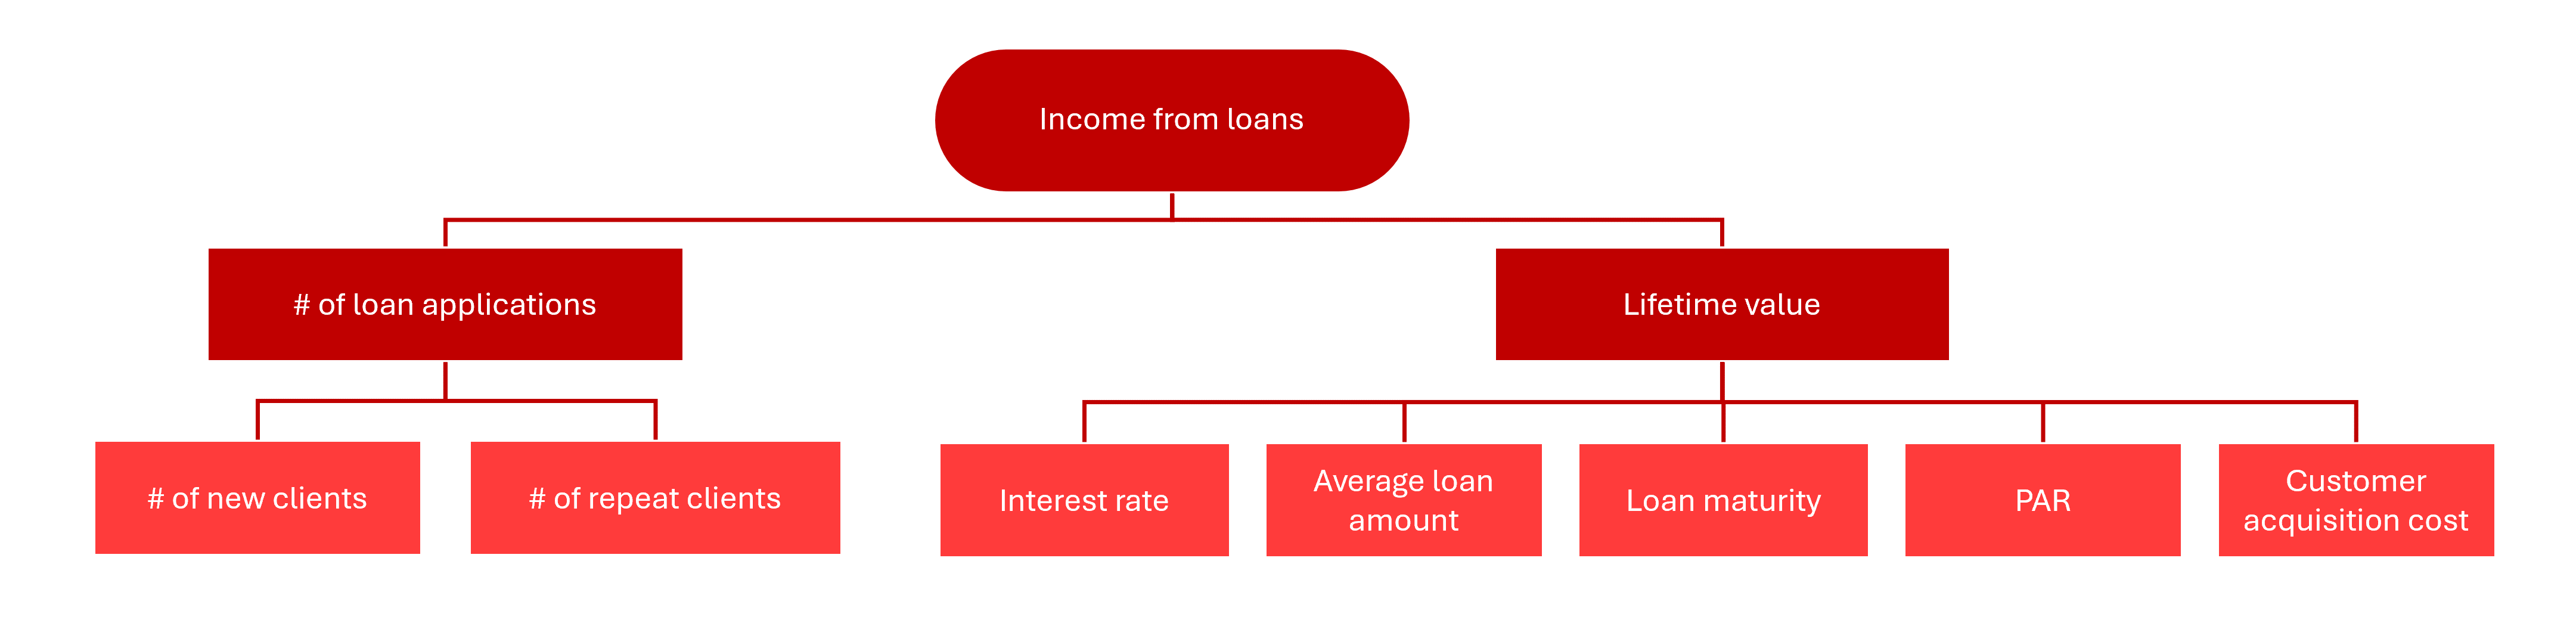
What does the number of new customers depend on?
- From the number of meetings with a credit expert, the number of calls from the call centre, the number of visits to the website, the number of downloads of the mobile app - depending on the engagement channel.
- From conversion to successful loan application - what percentage of all new customer applications were successfully received by the bank.
- From the time of filling in and the difficulty in completing the loan application (number of fields, length of the session).
- From the percentage of approved loans for new customers - shows how effective the scoring and risk assessment system is.
- Time to Yes - the faster a customer receives a decision, the higher their loyalty and likelihood of approval.
- Time to Money is an important factor in today's world, and customers appreciate promptness.
What does the number of repeat customers depend on?
- From customer retention rate (Retention - retention rate, Churn - churn rate)
- From customer experience - what's the difference between repeat acquisition and primary acquisition
- Net promoter score - coefficient
- Customer satisfaction index
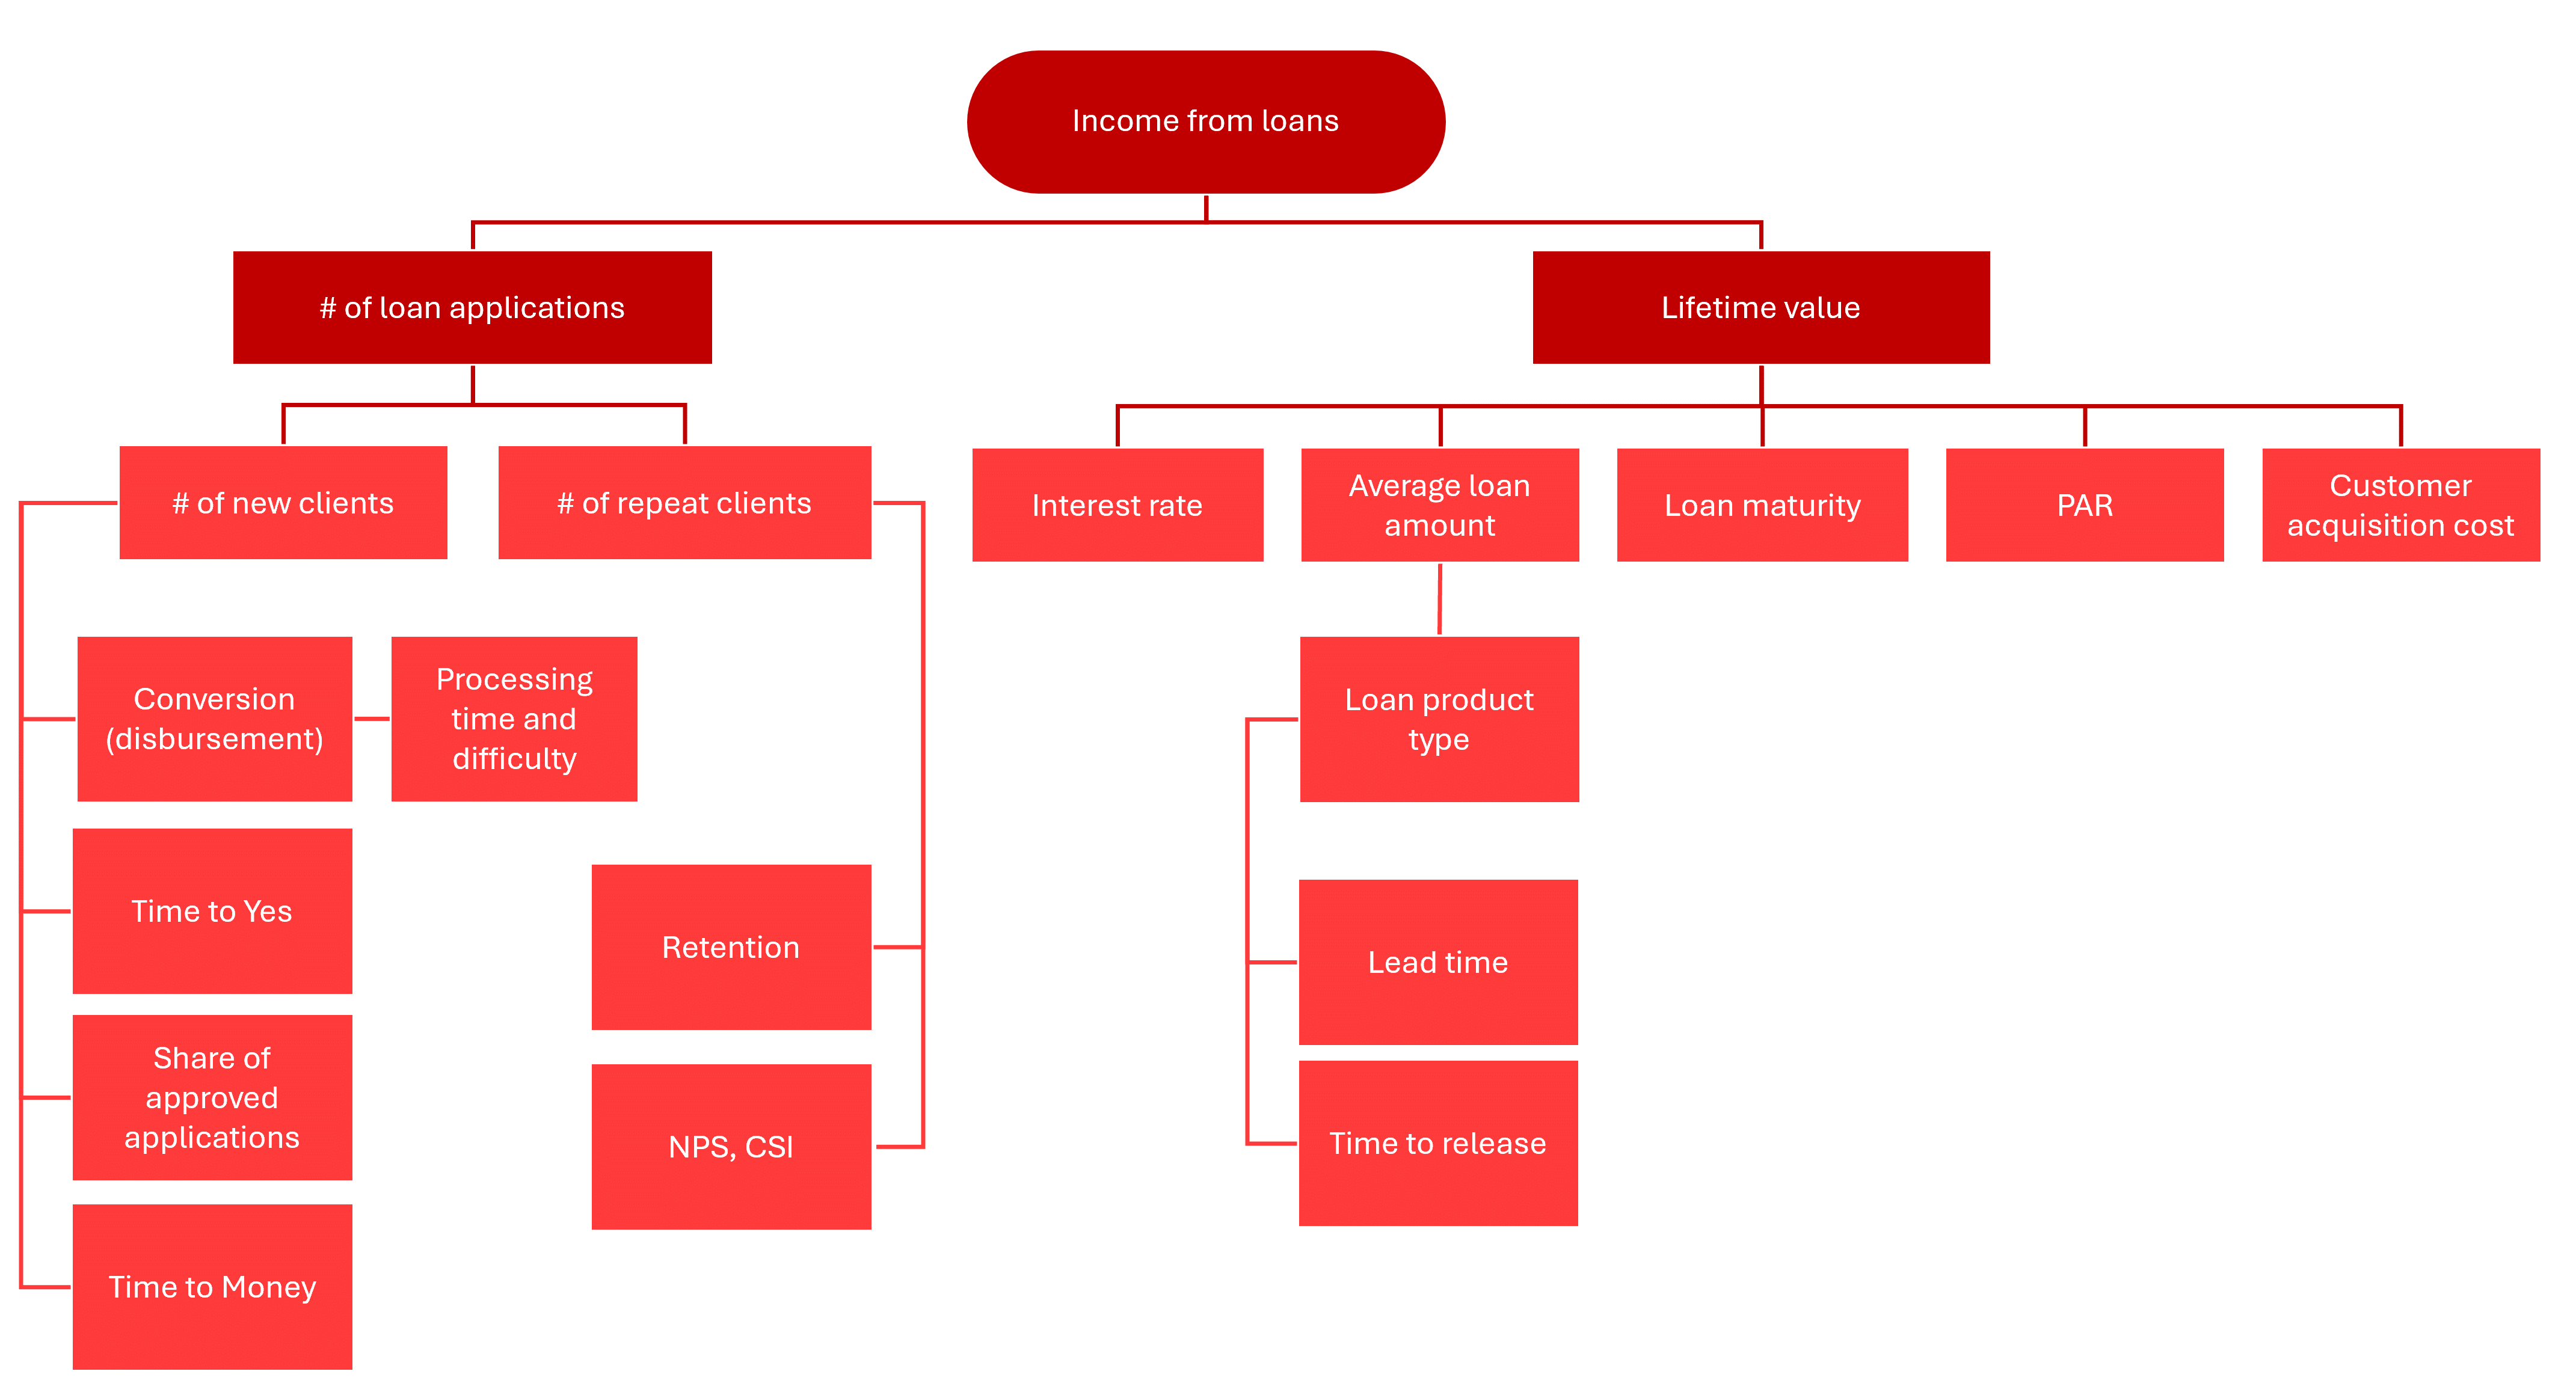
What does the average loan amount and term depend on?
- From the type of product: consumer loans are often lower amounts, mortgages or car loans are larger amounts.
- At this level, you can begin to measure the product development team's performance metrics: Lead time (Time from team commitment to release and customer use of new functionality); Time to release (Time from task readiness to when it hits the production environment)
Diagram 4: Summary of the metrics hierarchy (level 4).
The hierarchy can be decomposed further on, but we will stop at this step and start analysing it:
- Add data for each metric = this will allow you to check if the relationships between metrics are correctly defined and if you have accounted for all metrics.
- Analyse the hierarchy and identify bottlenecks.
- Compose and prioritise hypotheses affecting the growth of weak metrics.
- Update your product backlog with the above in mind.
By carefully monitoring all these metrics, it is possible to get a clear picture of how well the loan product is performing at each stage, identify weaknesses and promptly improve them. After all, the ultimate goal is not just to attract customers, but to build long-term and mutually beneficial relationships with them!